The figure below shows inputs, including raw materials and energy, and outputs that are products and emissions released into the environment.
The Group is working to reduce its impact on the environment by means of waste reduction and resource savings through promoting more efficient use of raw materials, energy, and water. We have also been advancing CO2 emissions reduction through our carbon neutral efforts.
In fiscal 2022, the sudden increase in production volume in the wake of COVID-19 slowed down, and social circumstances like the situation in Ukraine have also impacted production volume, resulting in a decrease in raw material input and product sales volume compared to fiscal 2021.
On the other hand, the switch to electricity derived from renewable energy sources that began from fiscal 2021 and the active promotion of solar power generation on the company's remises from fiscal 2022 made greenhouse gas (CO2) emissions much lower than the drop in our production activities.
From this report, we also began disclosing the amount of emissions of VOC*8 included in our chemical substance emissions.
Through the ongoing activities of our Group, we are contributing to the response to aspects of climate change such as warming by working to effect reductions in outputs that affect the environment, with respect to increases in input.
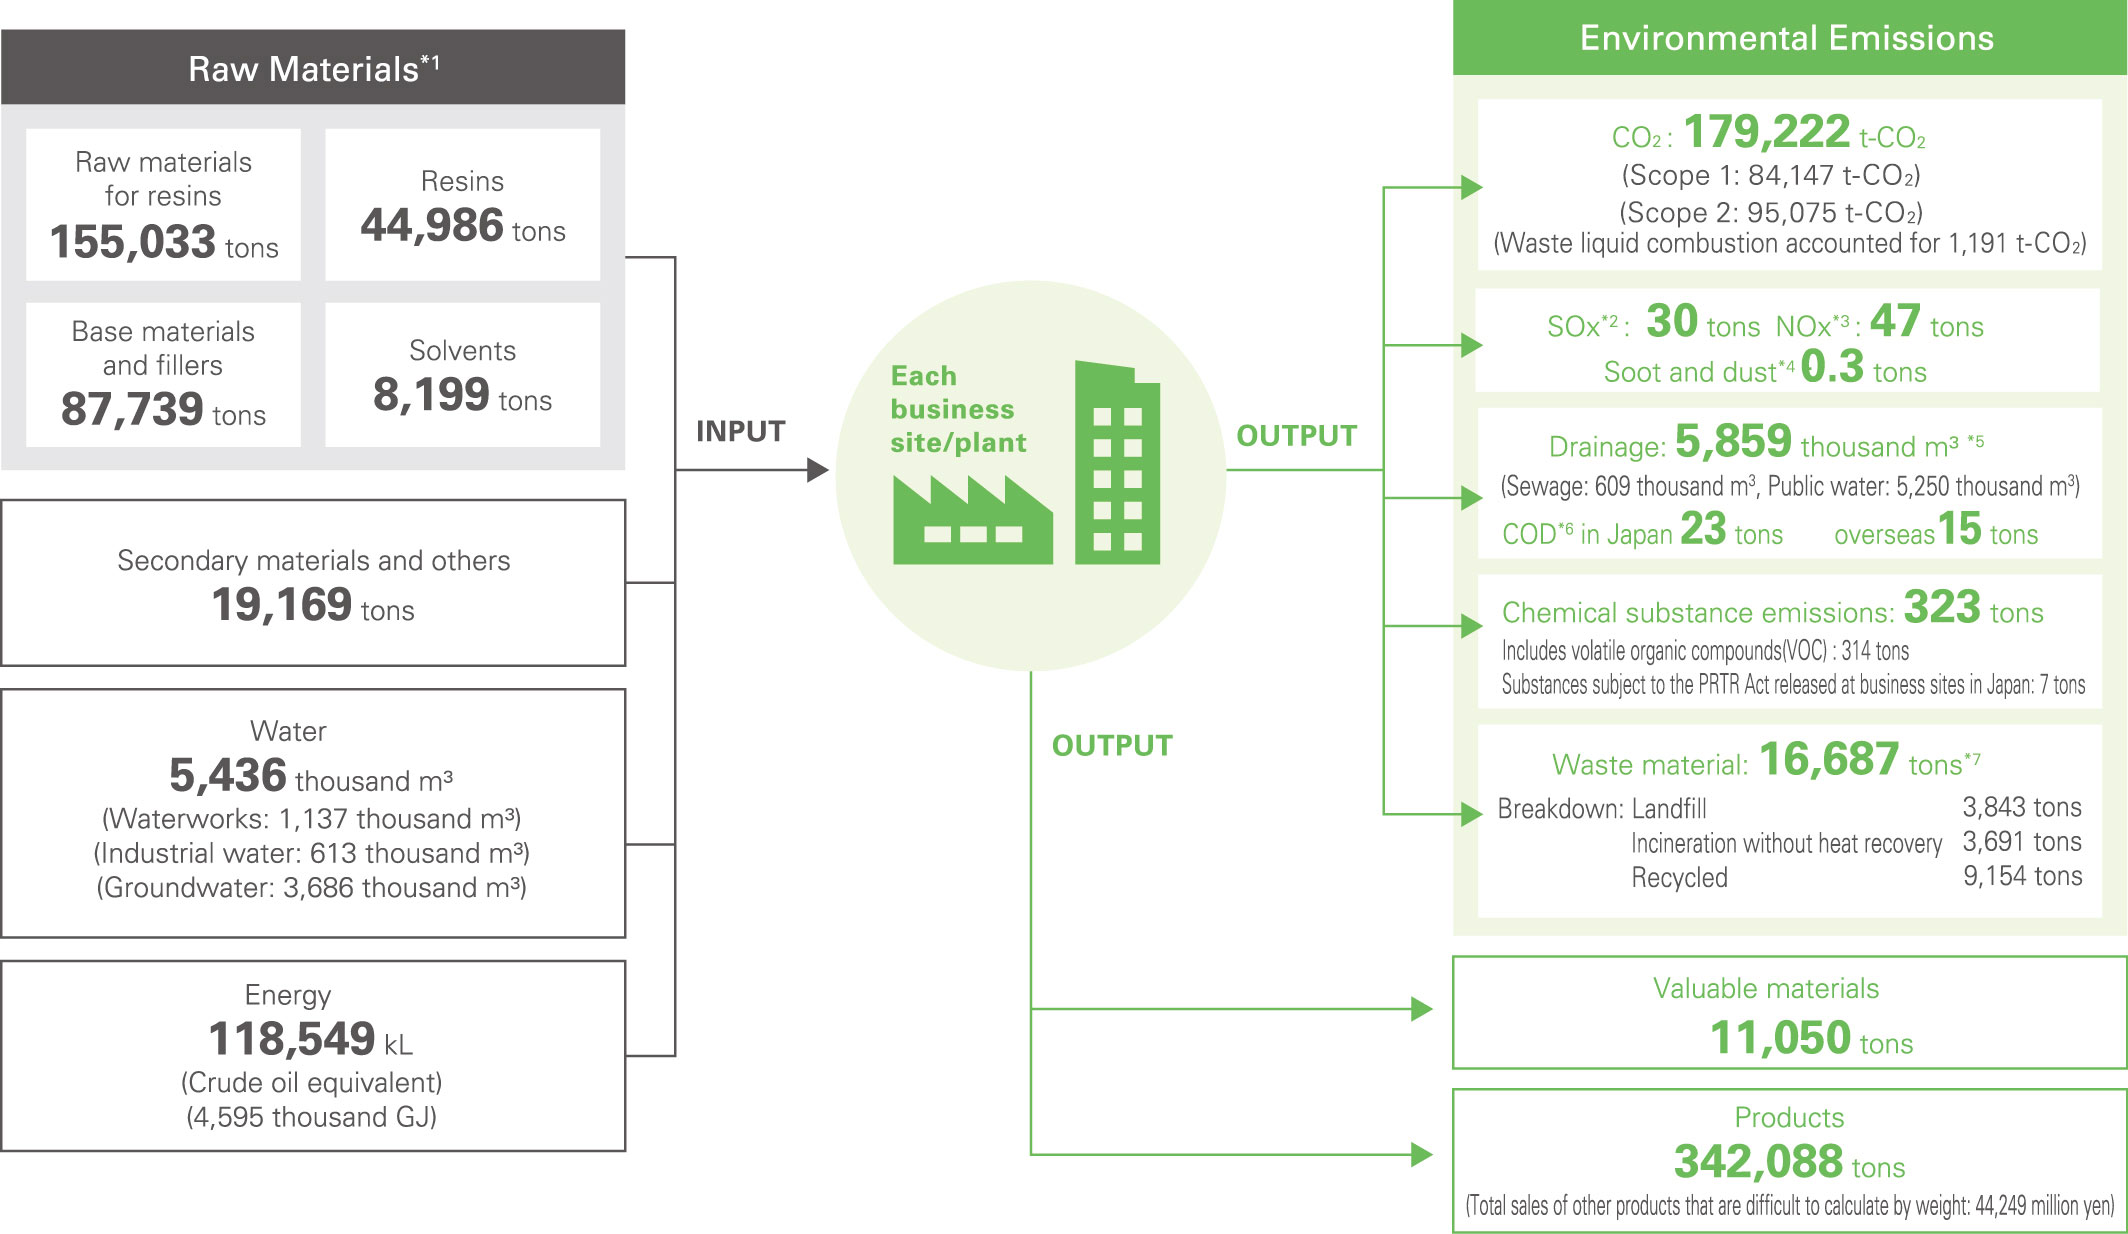
- *1: The ratio of renewable raw materials to total raw materials used is about 3.1% at the current point in time, but we will make efforts from the development stage onward in order to increase the ratio of renewable raw materials use.
- *2, 3, 4, 6: See the website glossary page. SOx, NOx, and soot and dust are calculated using the company's own formula based on exhaust gas readings and fuel usage amount, among other variables. Since methods of calculating emissions of soot and dust differ among countries, this figure is compiled solely for business sites in Japan at present. COD is calculated based on the measured concentration and drainage volume. Data on overseas COD cover sites that measure COD within drainage. Data for overseas sites are stated separately because the types of oxidant (potassium dichromate is mainly used overseas) used for measurement differ from those used in Japan.
- *5: Drainage volume is determined by calculating drainage into sewages based on the breakdown of total usage. Drainage into public water areas is calculated using readings from flow meters installed at business sites; while water usage volume is used for business sites without flow meters.
- *7: The volume of hazardous waste found in our total waste volume came to 5,492 t (based on the definitions used by each country). The volume of hazardous waste is not subject to assurance.
- *8: VOC (Volatile Organic Compounds)
- * The volume of products shipped and value of products sold are not subject to assurance.
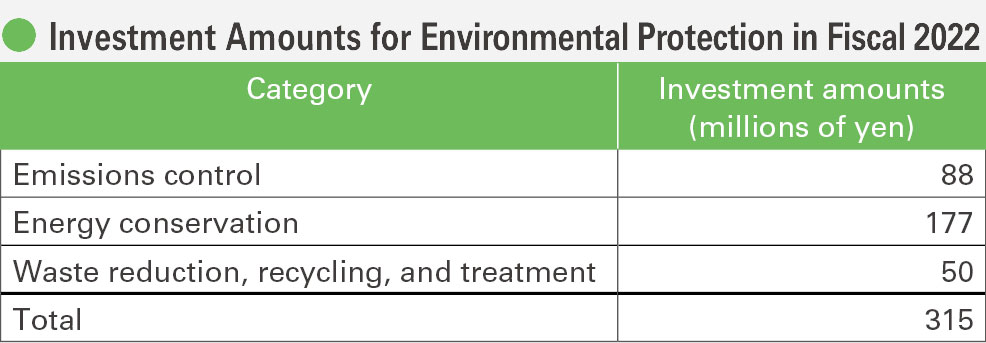
Investments for Environmental Protection
Our Group has compiled data annually on the amounts of investments in environmental protection of all Group companies in Japan since fiscal 2000. In fiscal 2022, 320 million yen in total was invested in such protection. Since fiscal 2020, we have been engaged in a full-fledged effort to adopt solar power generation based on our commitment to carbon neutrality, and we continued to phase it in at each of our business sites in fiscal 2022. Further expansion is planned for fiscal 2023. We will continue to promote aggressive investment to reduce CO2 emissions.
Topics More
- 2024/02/01 Sustainability Sumitomo Bakelite Co., Ltd. announces its establishment of “Human Rights Policy for the Group of Sumitomo Bakelite Co., Ltd.”
- 2023/10/31 Sustainability Integrated Report 2023 of Sumitomo Bakelite Co., Ltd. has been issued.
- 2023/06/21 Sustainability Selected as an iSTOXX® MUTB Japan Platinum Carrier 150 Index
- 2022/10/31 Sustainability Integrated Report 2022 of Sumitomo Bakelite Co., Ltd. has been issued.
- 2022/10/14 Sustainability Sumitomo Bakelite Co., Ltd. Receives Gold Medal in EcoVadis Sustainability Assessment
- 2022/05/27 Sustainability Participation in the 30by30 Alliance for Biodiversity
Call or email us about Sustainability
 Inquiry