
Message from Finance and Accounting Officer
Sustainable improvement in corporate value by transforming our product portfolio and optimizing capital
Looking Back at Our FY2024 Results
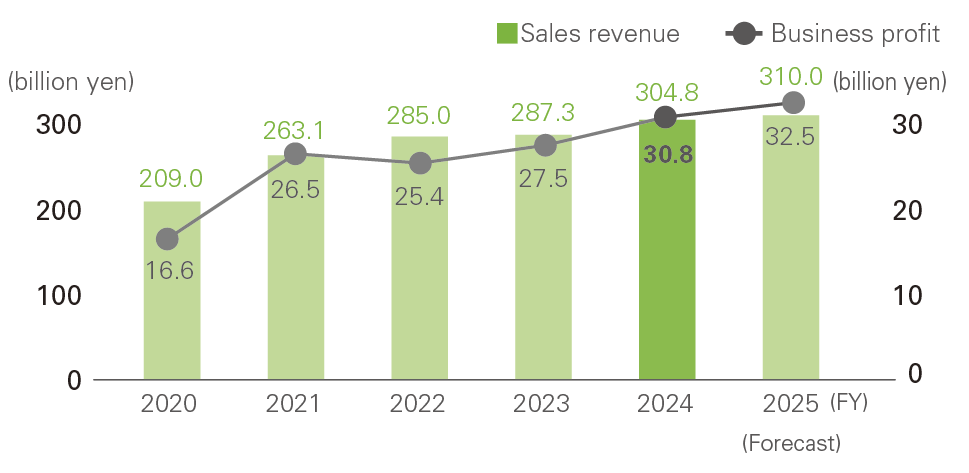
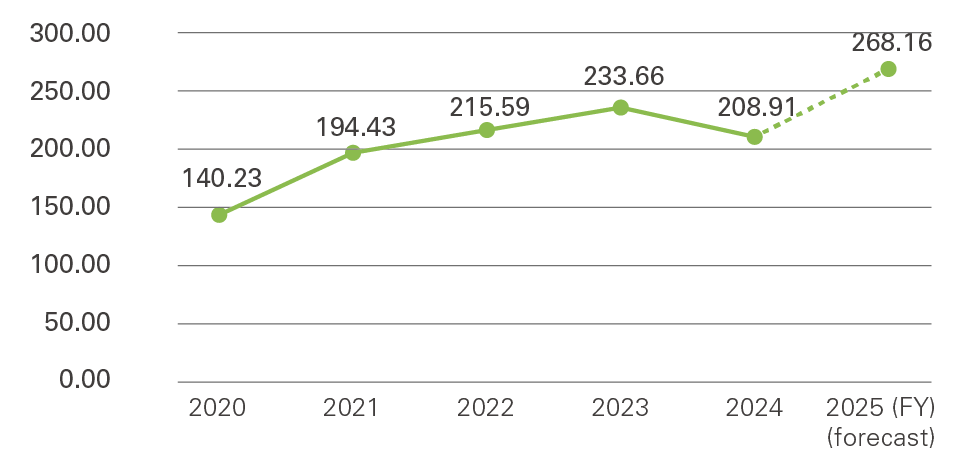
We achieved our best performance ever in FY2024, attaining sales revenue of ¥300 billion and business profit
of ¥30 billion, targets that our Group has held for many years. There was steady progress in semiconductor
materials, driven by strong domestic demand in China. In quality of life products, we have seen good growth
overall, including the expansion of sales of films for electronic components and semiconductors to China and
the ASEAN region.
For high-performance plastics, although sales remained robust in Asia, the business
environment was tough, including a slump in automotive applications in Europe and the US. The phenol-related
business in North America in particular recorded impairment losses, due in part to a more competitive
environment, which resulted in a lower operating profit and profit attributable to owners of parent compared
to the previous year. However, this was also a year of steady progress toward structural reforms to improve
profitability, including consolidating production sites, putting state-of-the-art facilities into operation,
getting rid of unprofitable products, and establishing new products.
FY2024 Results
| FY2023 | FY2024 | Increase/Decrease | |
| Sales revenue | 287.3 billion | 304.8 billion | 6.1% |
| Business profit | 27.5 billion | 30.8 billion | 12.3% |
| Operating profit | 27.2 billion | 24.8 billion | -8.9% |
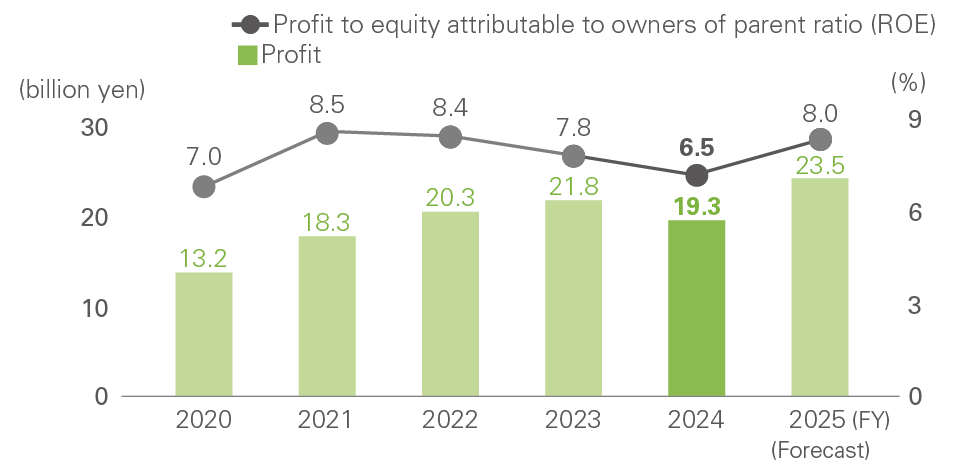
| Profit attributable to owners of parent |
21.8 billion | 19.3 billion | -11.7% |
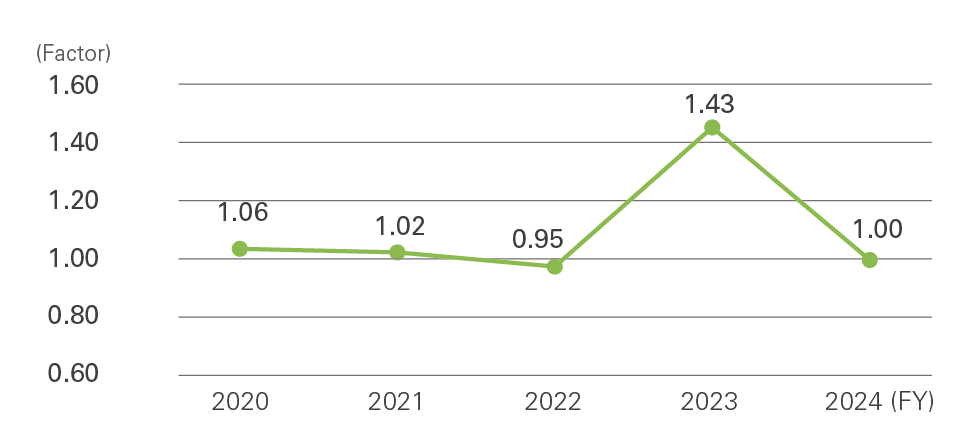
| ROE | 7.8% | 6.5% | ー |
Financial Targets for FY2025
Despite a share buyback of ¥20 billion, ROE fell to 6.5% in FY2024 due to a decrease in profit. There are
uncertainties in FY2025, including the rising value of the yen and reciprocal tariffs causing stagnation in
the automotive market. However, with the continued strength of the Chinese semiconductor market and a review
of our product portfolio, we aim to increase revenue and profit from last fiscal year and achieve record
results this year, aiming for a sales revenue of ¥310 billion, business profit of ¥32.5 billion, operating
profit of ¥31 billion, and profit of ¥23.5 billion. Alongside this, ROE is expected to improve to 8%, and we
will continue to promote business growth and capital optimization in order to achieve 9% in FY2026 (the final
fiscal year of the current Medium-term Business Plan) and the target of 10% for FY2030.
We have planned
shareholder returns of ¥30 billion during the current Medium-term Business Plan period. Our policy is to pay
stable, continuous dividends, with a guideline dividend payout ratio of 40%.
Sales Revenue and Business Profit
ROE Transition
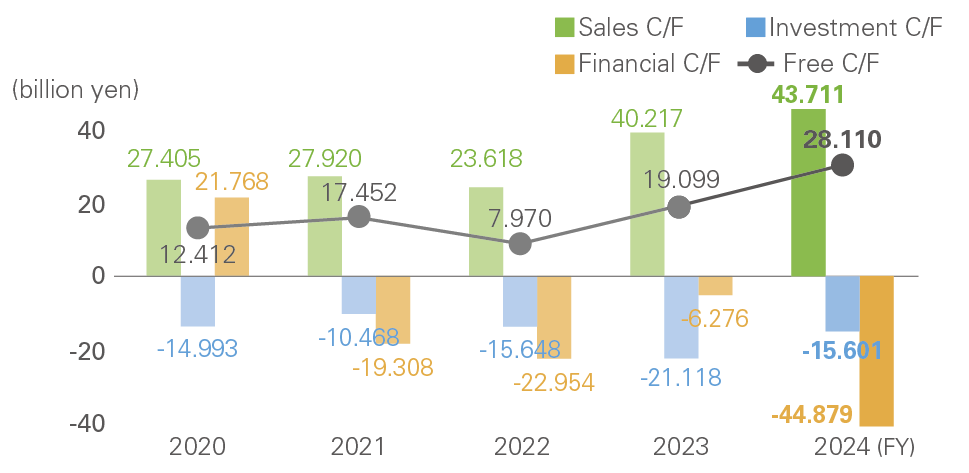
Cash Allocation: Results and Forecast
We are progressing as planned with the capital investment of ¥50 billion and growth investment of ¥20 billion,
as set out in our Medium-term Business Plan. As part of our growth investment, we are integrating our
corporate-wide LOB systems to realize data-driven management. For research and development, we are investing
in future-looking new projects such as the Project Team to Commercialize Brain-Machine Interface (BMI) and the
Project Team to Prepare for Mass Production of Functional Membranes for Hydrogen Production.
In terms of strategic investment, we are investing in venture capital and actively working on external
collaboration projects, such as establishing the Co-creation Research Center with Tohoku University. We are
exploring opportunities for M&A, mainly in our priority areas of semiconductors and healthcare. Merging with
companies with different ideas and DNA could bring huge opportunities for our Group. We will continue to
explore M&A opportunities that will help to transform our business portfolio.
Distribution of Operating Resources Taking the Cost of Capital into Consideration (FY2024–2026)
| Cash allocation | Purpose-specific fund use plans |
| Capital investment ¥50 billion |
Enhancement of the revenue-generating power of existing businesses (Medium-term Strategy target 1) and execution of equipment investments in timely manner to assure stable supply of products to our customers |
| Growth investment ¥20 billion |
Acceleration of research and development to create new products and solutions (Medium-term Strategy target 2) as well as digital transformation and green transformation drives |
| Strategic investment ¥50 billion |
Exploration of new knowledge for viable future projects, acceleration of open innovations, and execution of strategic M&As to transform our business portfolio |
| Shareholder return ¥30 billion |
[Shareholder return policy] “Return profits in stable and continuous manner” Dividend payout ratio: Aim at approximately 40% (shift from the conventional target of 30% or more) |
Dialogue with Shareholders and Investors
We place great importance on dialogue with our shareholders and investors, aiming for sustainable growth and
medium- to long-term improvement in corporate value through active communication. We are increasing the number
of IR meetings each year. Over 300 meetings were held in FY2024, over 10% of which were attended by Directors.
We are also focusing on creating opportunities for communication. In May 2024, we held small meetings to
explain our Medium-term Business Plan to major sell-side analysts and buy-side institutional investors, and in
December we held small meetings for major sell-side analysts.
From 2025, we have also started new Shareholder Relations (SR) activities in order to ensure shareholders’
views are reflected in company management from a long-term perspective. We will continue to expand
opportunities for dialogue, through briefing sessions and so on.
Valuable feedback from shareholders and investors will be shared with the Board of Directors and leveraged in
our measures toward sustainable growth.
Cash Flow
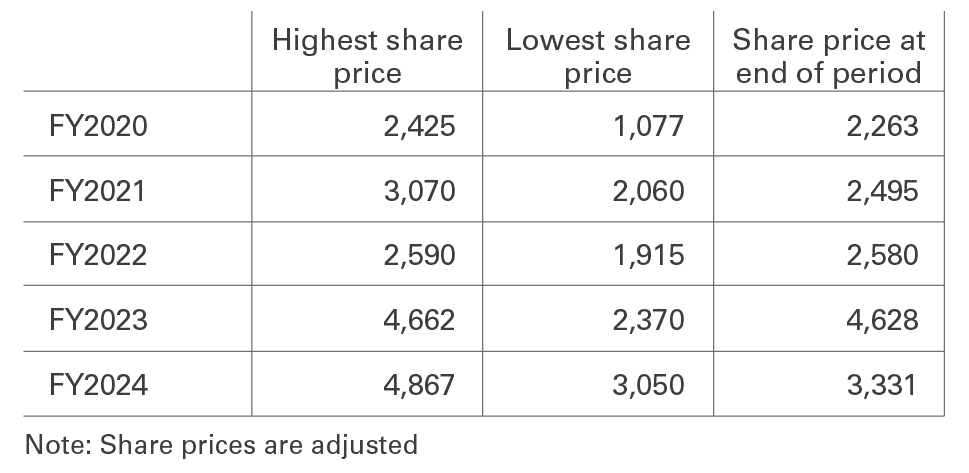
Share Price Transition
EPS Transition
PBR Transition
Boosting Shareholder Return
As a Group, we place great importance on sustained improvement in corporate value and returning profits to
shareholders. In light of our cash flow situation, we implemented a share buyback of ¥20 billion in FY2024 in
order to rectify the balance sheet and enhance shareholder returns. Although our profit was lower than the
previous fiscal year, the annual dividend increased by ¥20, including a ¥5 dividend to celebrate our 70th
anniversary, resulting in a dividend payout ratio of 46%. We plan to increase the annual dividend by ¥10 in
FY2025, with a predicted dividend payout ratio of 39%, close to the target of 40%.
In the past, shareholder
returns have essentially been achieved by paying progressive dividends. To clarify our policy of returning
profits in a stable and continuous manner, we would like to consider introducing dividends that are not
affected by profits, such as dividend on equity ratio (DOE). Going forward, we will continue to provide stable
shareholder returns based on responsive decision-making, comprehensively taking into account the balance of
funding requirements, the situation of investments, future plans, and so on.
Dividends and Dividend Payout Ratio (Consolidated)
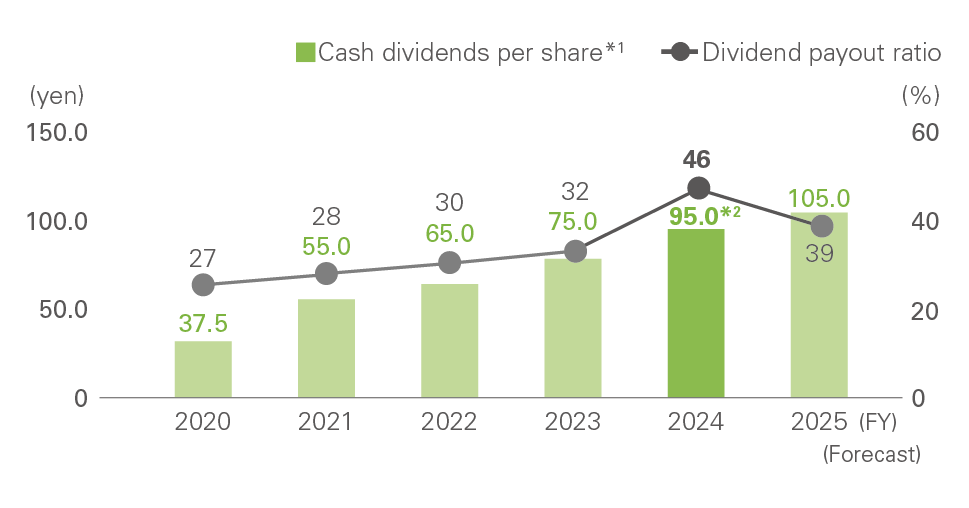
*1 We have executed a two-for-one stock split of common shares with an effective date of April 1, 2024. The dividend amounts above (yen per share) are calculated assuming that the stock split was executed at the beginning of FY2020.
*2 Including ¥5 commemorative dividend to mark our 70th anniversary (March 1, 2025).
Measures to Improve Invested Capital Efficiency
Use of SB-ROIC
We introduced SB-ROIC as an internal indicator in FY2020 in order to visualize invested capital efficiency for each business area within our Group. ROIC is usually calculated by dividing operating profit (after tax) by invested capital (borrowings + shareholders’ equity). However, it is difficult to separate borrowings and shareholders’ equity into separate business areas, making it difficult to calculate ROIC for each business area. SB-ROIC, on the other hand, is calculated by taking business profit as the numerator and dividing it by invested business capital, defined as accounts receivable + inventory + fixed assets + stock held - accounts payable, the investment amount used in business operations. This allows us to evaluate invested capital efficiency for each business area individually. Using the SB-ROIC tree, we can evaluate and manage profitability and investment efficiency by business area and by company, which will raise awareness of cost of capital across the Group as a whole.

Future Initiatives
In the four years since we began using SB-ROIC, we have ascertained and analyzed the invested capital
efficiency in each business area. In FY2025, to ensure management with an even greater awareness of cost of
capital, we have set SB-ROIC targets for each business area and we are working on full-scale management
initiatives to achieve these targets. Alongside efforts to achieve business profits, the business divisions
will work to strengthen management of receivables, payables, and inventory, as well as efforts to utilize
fixed assets. The corporate divisions will work to streamline Company-wide assets, raise awareness among
employees, and improve the accuracy of indicators.
These actions will enable us to improve invested capital efficiency and optimize the allocation of resources
to businesses with high investment efficiency. This will lead to further improvement in SB-ROIC and
ultimately ROE, which is our stated financial target.